
AUSTRALIA PROJECT
We initially classified this mining area as a placer-gold deposit located near a river, based on the mine owner's statement that gold had been found on the riverbed. However, when gold was also identified on the nearby hillside, we suspect earlier misinterpretation. Further topographical analysis revealed that the river in this region is a short inland watercourse situated within a small enclosed basin. This indicates that the placer gold found on the riverbed was likely derived from lode-gold mineralization on the surrounding mountains, having been weathered and transported downslope.
This finding highlights an interesting phenomenon: the coexistence of both placer gold and lode gold within the same locality.
Given this context, the widespread and deep distribution of gold becomes reasonable. Lode-gold deposits typically form along faults associated with volcanic activity and can extend to significant depths, commonly ranging from 0 to 1500 meters.
Based on our statistical analysis, we estimate the gold content using two depth intervals (0–20m and 0–1500m) yielding the following total gold-content estimates:
Depths : 0-20M
Gold contains total: 20.75 mt
Depths : 0-1500M
Gold contains total: 175.96 mt
Chart: Australia gold mine deposit analyzing.
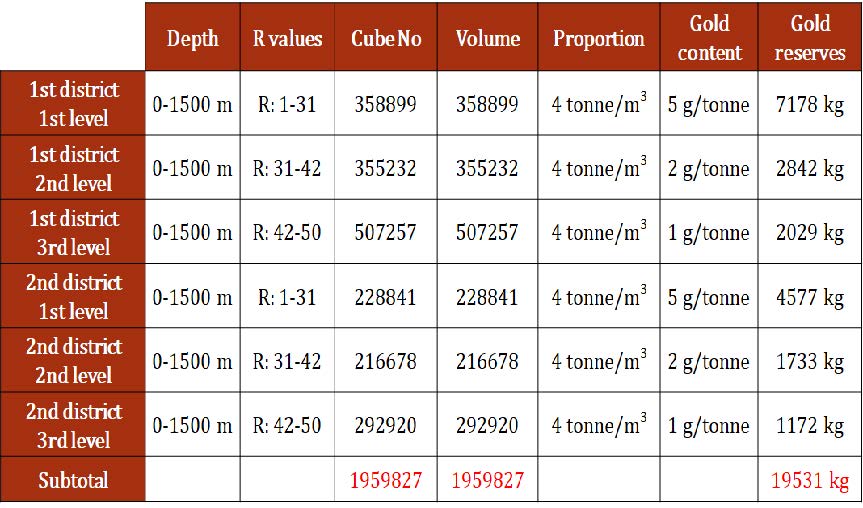
A. Analysis Table of Exploration Results in Zone 1
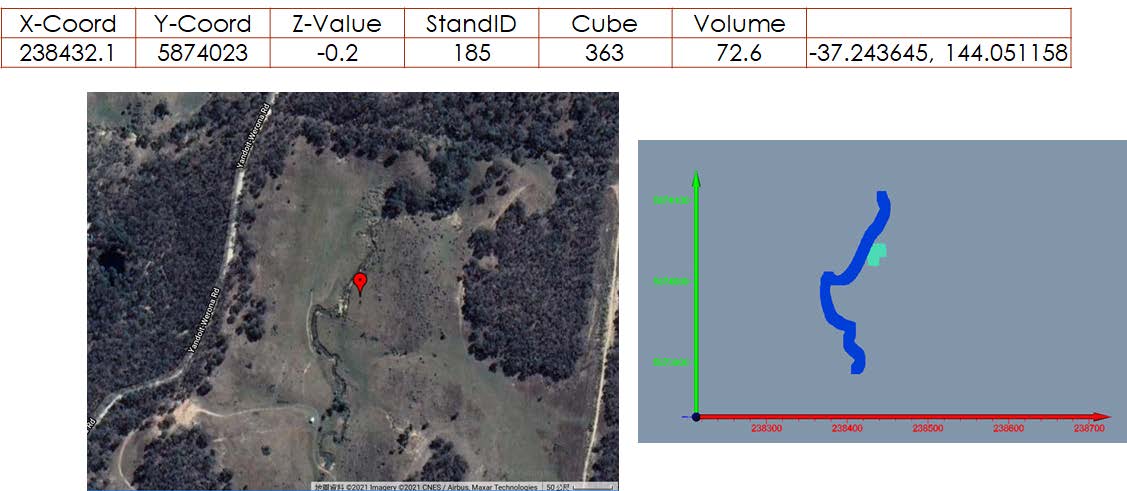
After GIS optimization analysis, the best outcrop in the first area was determined.Picture: The best outcrops location information for 1st districts
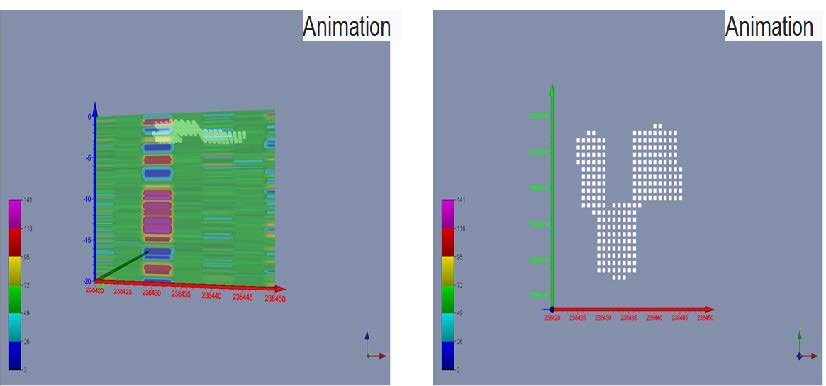
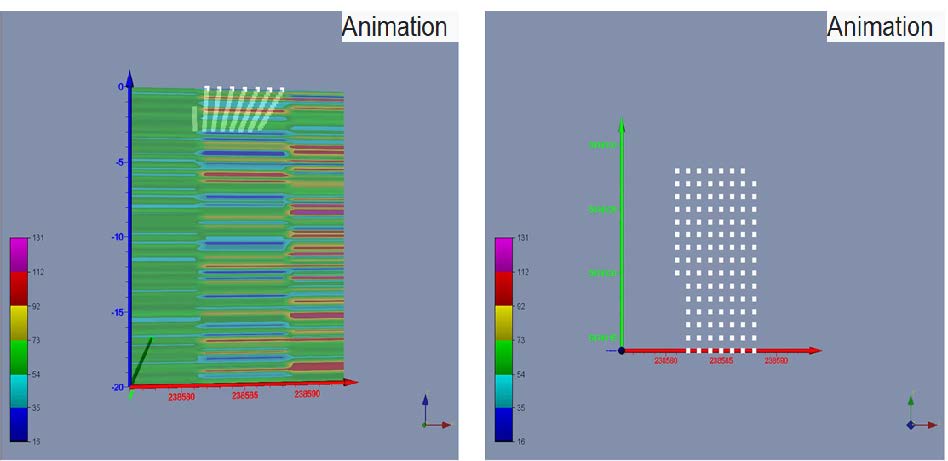
Picture: The simulated rock crops of the outcrops of sand gold mines for the 1st District (with ROCKS and golds).
B. The optimal location for 2nd districts
Picture: The best outcrops location information for 2nd districts.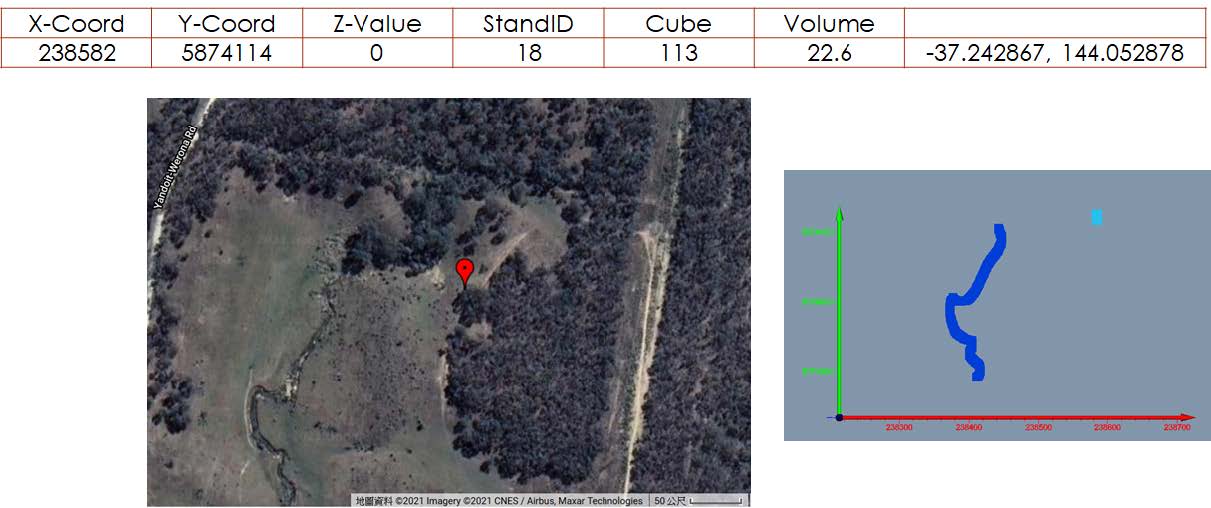
Picture: The simulated rock crops of the outcrops of sand gold mines for the 2nd District (with ROCKS and golds).
C. The optimal location Next to the road
Picture: The best outcrops location information for 3rd districts.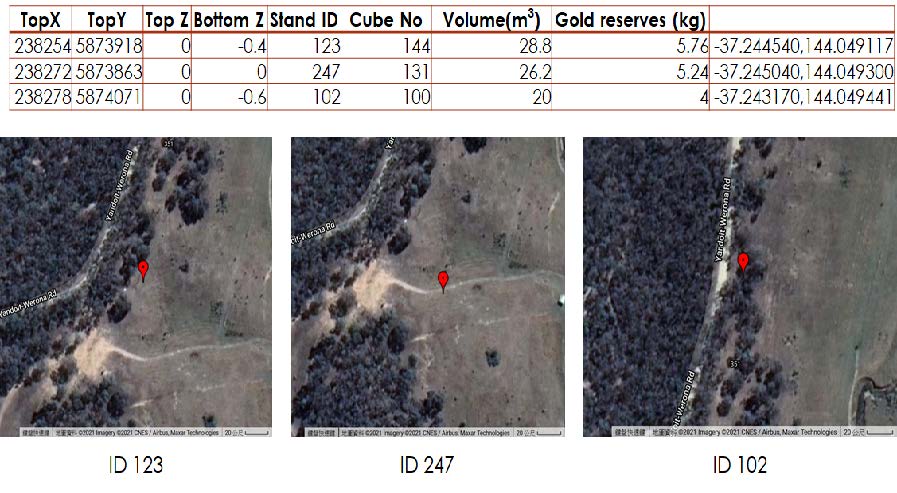
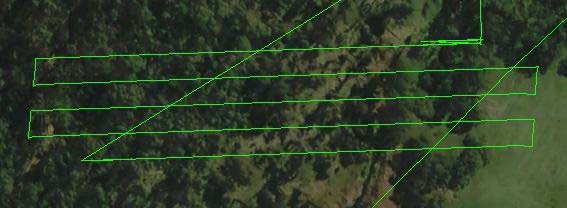
Drone flying plan for the selected exploration area:
0-8meters dump locations with horizontal distribution of gold mines distribution in the area.
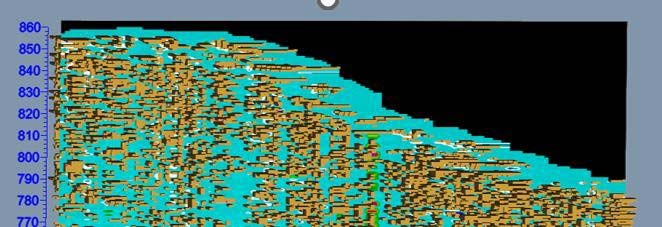
If we search for the horizontal dash we can find the dumps with higher contain of gold.
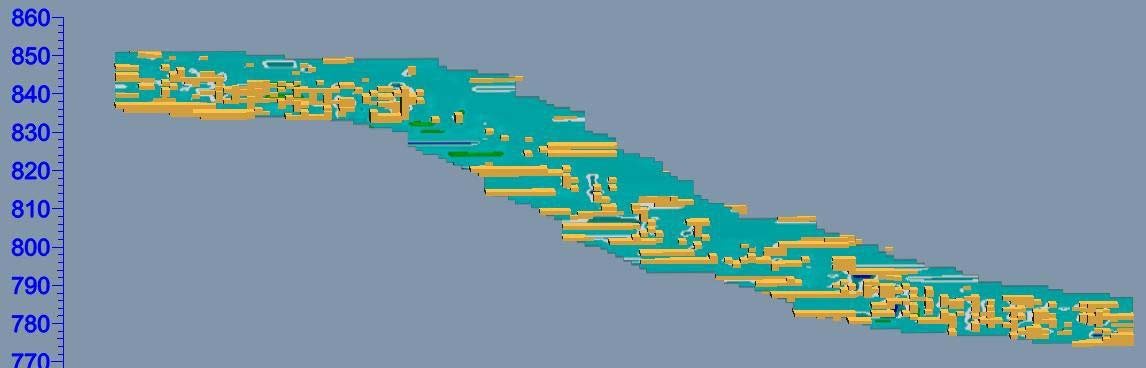
Interpretation for dump areas with gold mines in the area.
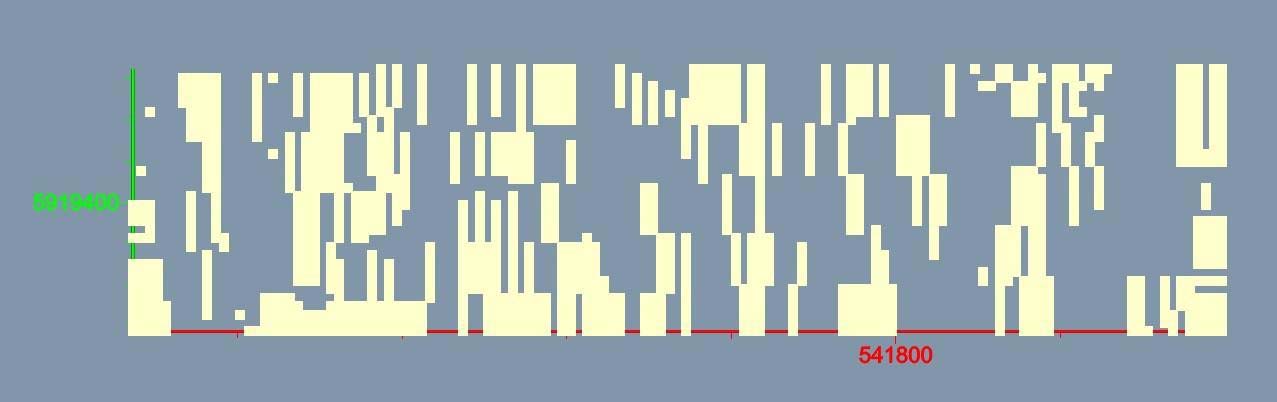
Picture: Top views of dumps with higher gold contain.
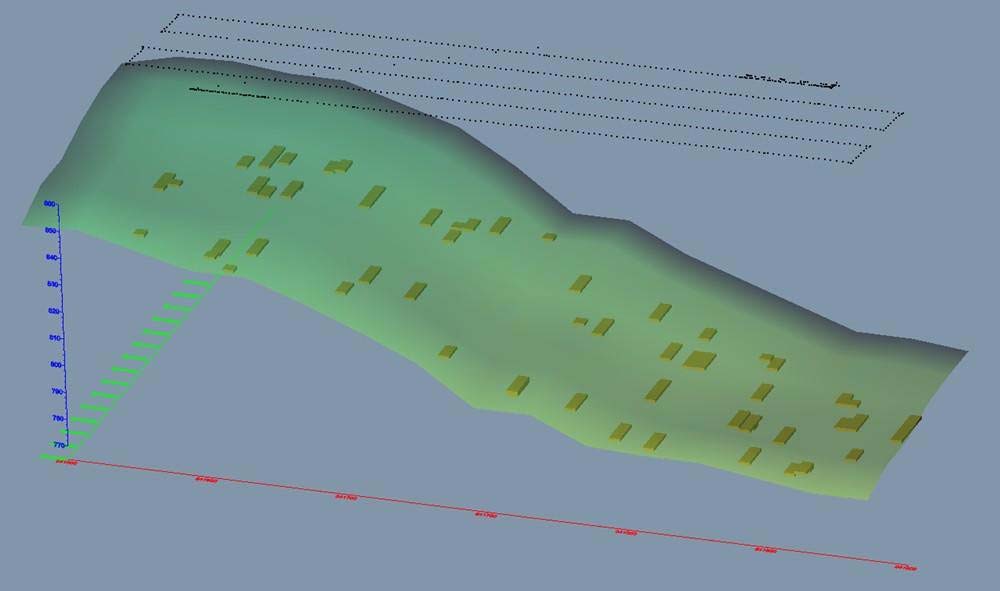
Picture: 3D Simulation.
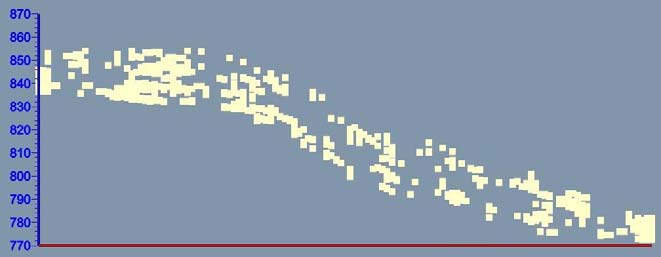
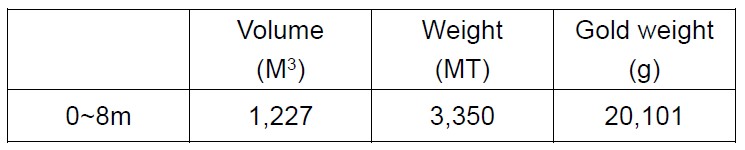
Estimated production of tailing dumps in the area
If tailing dumps density are 2.73 t/m3, Au (g/t) are 6 grams.
Are you ready to explore this fruitful treasury world?
Contact us now for more information.
Global contact
Mr. Ken Kang
Whatsapp: +886 936 700 223
WeChat: 
Email: Ken@uavexplore.com
China contact
Mr. Chen WeiFa
Whatsapp: +51 959 388 377
WeChat: 
Email: chen@uavexplore.com
- © 2025. All Rights Reserved.